Investment Performance
Investment Performance
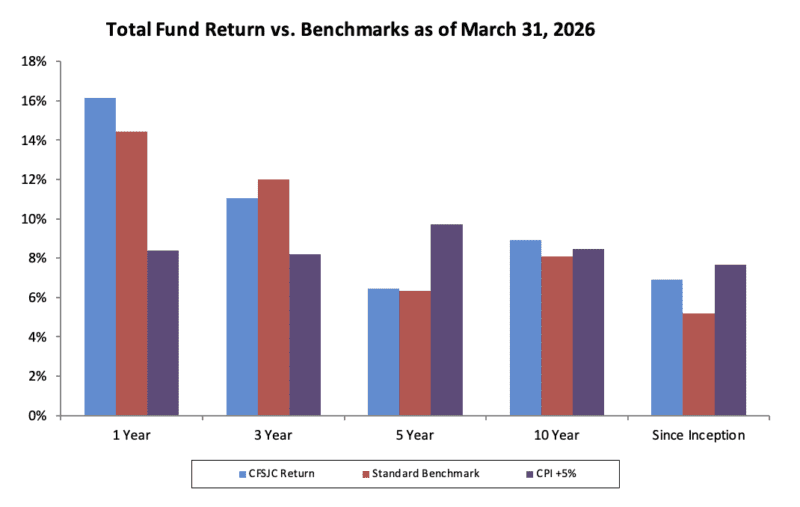
Investment returns, net of fees, for the periods ending March 31, 2026, were as follows:
| CFSJC Return | Standard Benchmark | CPI + 5% | |
| One Year | 16.1% | 14.4% | 8.4% |
| Three Year | 11.1% | 12.0% | 8.2% |
| Five Year | 6.4% | 6.3% | 9.7% |
| Ten Year | 8.9% | 8.1% | 8.5% |
| Since Inception | 6.9% | 5.2% | 7.7% |
The Standard Benchmark is comprised of the following weighted indices: 65% All Country World Index and 35% Barclays Aggregate Bond Fund.
The Community Foundation also compares our performance to a long-term benchmark comprised of 5% plus the rate of inflation as measured by the Consumer Price Index (CPI). Over the long-term, the Foundation seeks to earn 5% plus CPI to cover the cost of annual grants to charity while protecting the real value of the underlying endowments.